
Introduction
The Windsor Squareback body is a simplified automotive bluff body geometry used as Case 1 of the 4th Automotive CFD Prediction Workshop (AutoCFD 4). The workshop series aims to assess the predictive capability of CFD codes for road-car geometries through mandatory geometry, boundary conditions and computational grids, providing practical modelling guidelines to the automotive community.
This validation case simulates the Windsor Squareback body at 2.5° of yaw at a Reynolds number of 3 million based on vehicle length, within a wind-tunnel like domain. The yaw angle introduces asymmetry into the wake structure and provides a demanding test of the solver's ability to capture crossflow-driven separation and the resulting asymmetric rear surface pressure distribution. As well as force, moment and surface pressure data, non-intrusive PIV measurements in the wake are also available for comparison. Results are compared against experimental surface pressure measurements.
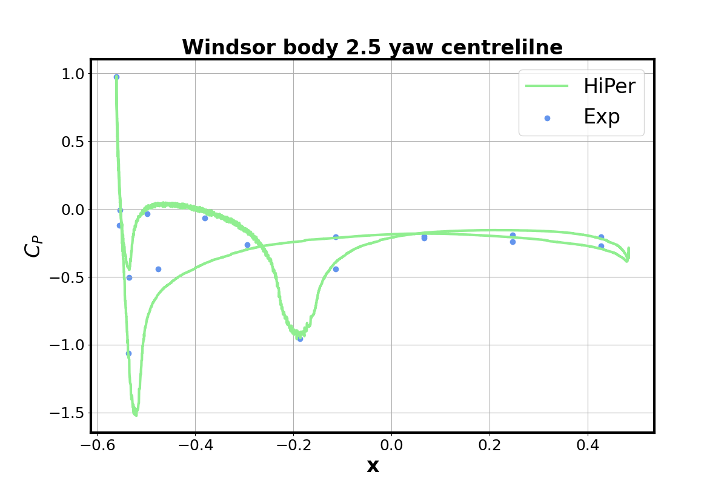
Centreline Pressure Coefficient
The centreline pressure coefficient (Cp) distribution along the body compares HiPer against experimental data. The plot captures the stagnation region at the front, acceleration over the nose, the roof boundary layer development and the base pressure recovery. HiPer shows good agreement with the experimental measurements across the full body length.
Rear Surface Pressure Distribution
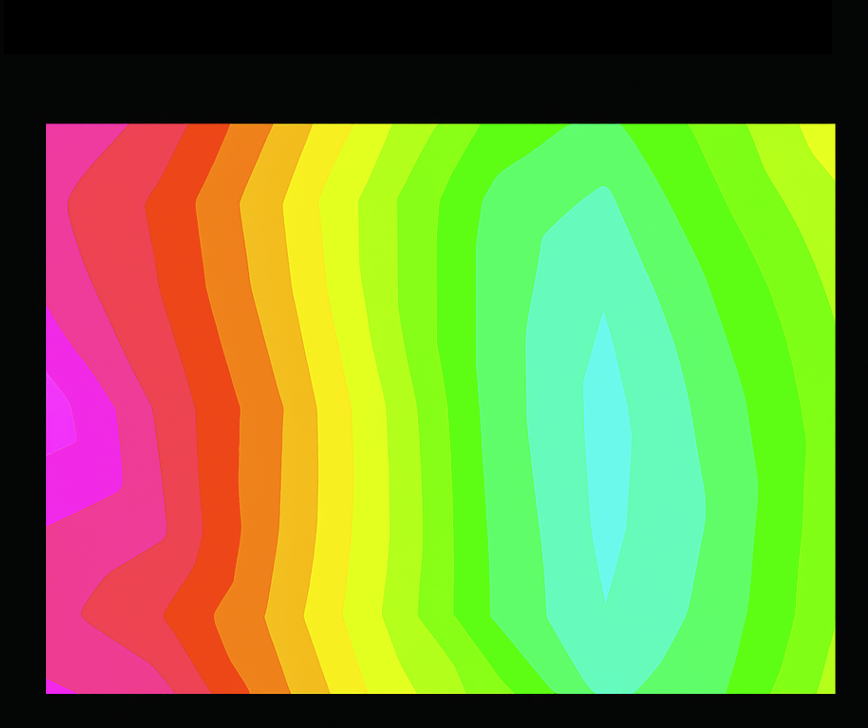
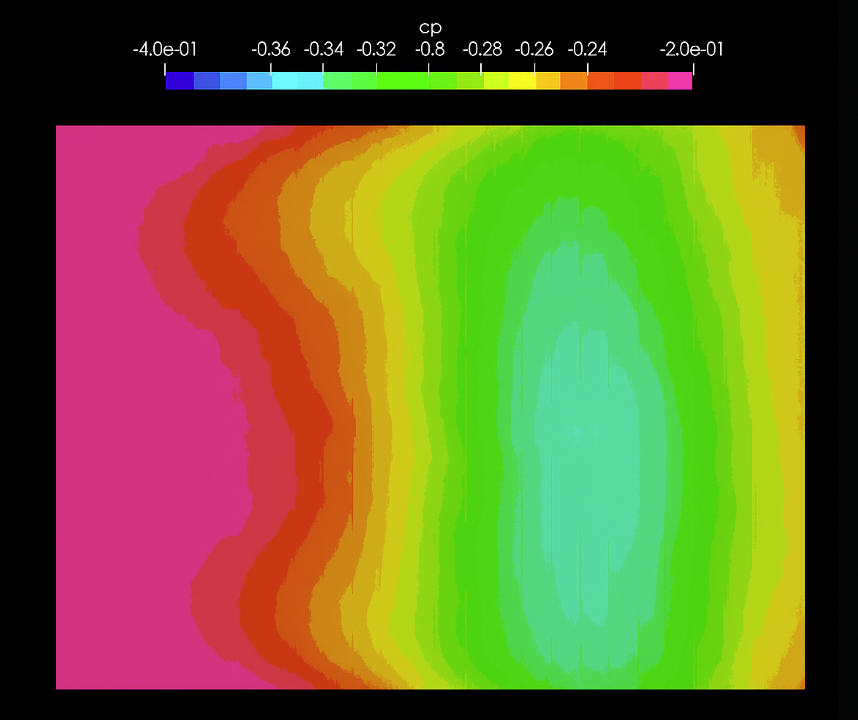
The contour plots below compare the time-averaged pressure coefficient on the rear (base) surface of the Windsor body. The asymmetric pressure distribution caused by the 2.5° yaw angle is clearly visible in both the experimental data and the HiPer simulation. The low-pressure core and its lateral displacement are well captured by HiPer.
Experimental
HiPer
Flow Visualisation
The video below shows the Q-criterion isosurfaces coloured by velocity magnitude, illustrating the complex turbulent wake structure behind the Windsor Squareback body at 2.5° yaw. The asymmetric wake separation and the detailed vortical structures captured by HiPer are clearly visible.
Computational Performance
127M
Mesh Cells
4×
NVIDIA A6000 GPUs
25 min
Per Convective Time Unit
Bring HiPer Onboard
Interested in learning what HiPer CFD can do for your organisation. Contact us for more information or to arrange a demo.