
Introduction
Ice accreting on a wing leading edge can build a variety of structures, and among the most aerodynamically damaging is the horn — a sharp spike protruding from the nose. The horn fixes the separation point at the leading edge and drives a large, strongly unsteady region of recirculating flow over the upper surface, which governs the pressure distribution and degrades the aerodynamic performance of the section.
The EG1164 ice shape was generated on a NACA 23012 in the Icing Research Tunnel at NASA Glenn Research Center, as part of a joint project between NASA, ONERA and the University of Illinois. The accretion was then reproduced on a model and tested in a wind tunnel to measure its effect on aerodynamic performance, building a benchmark database of full-scale ice accretions and the penalties they cause. This case has now been simulated with HiPer and validated against the data.
Results
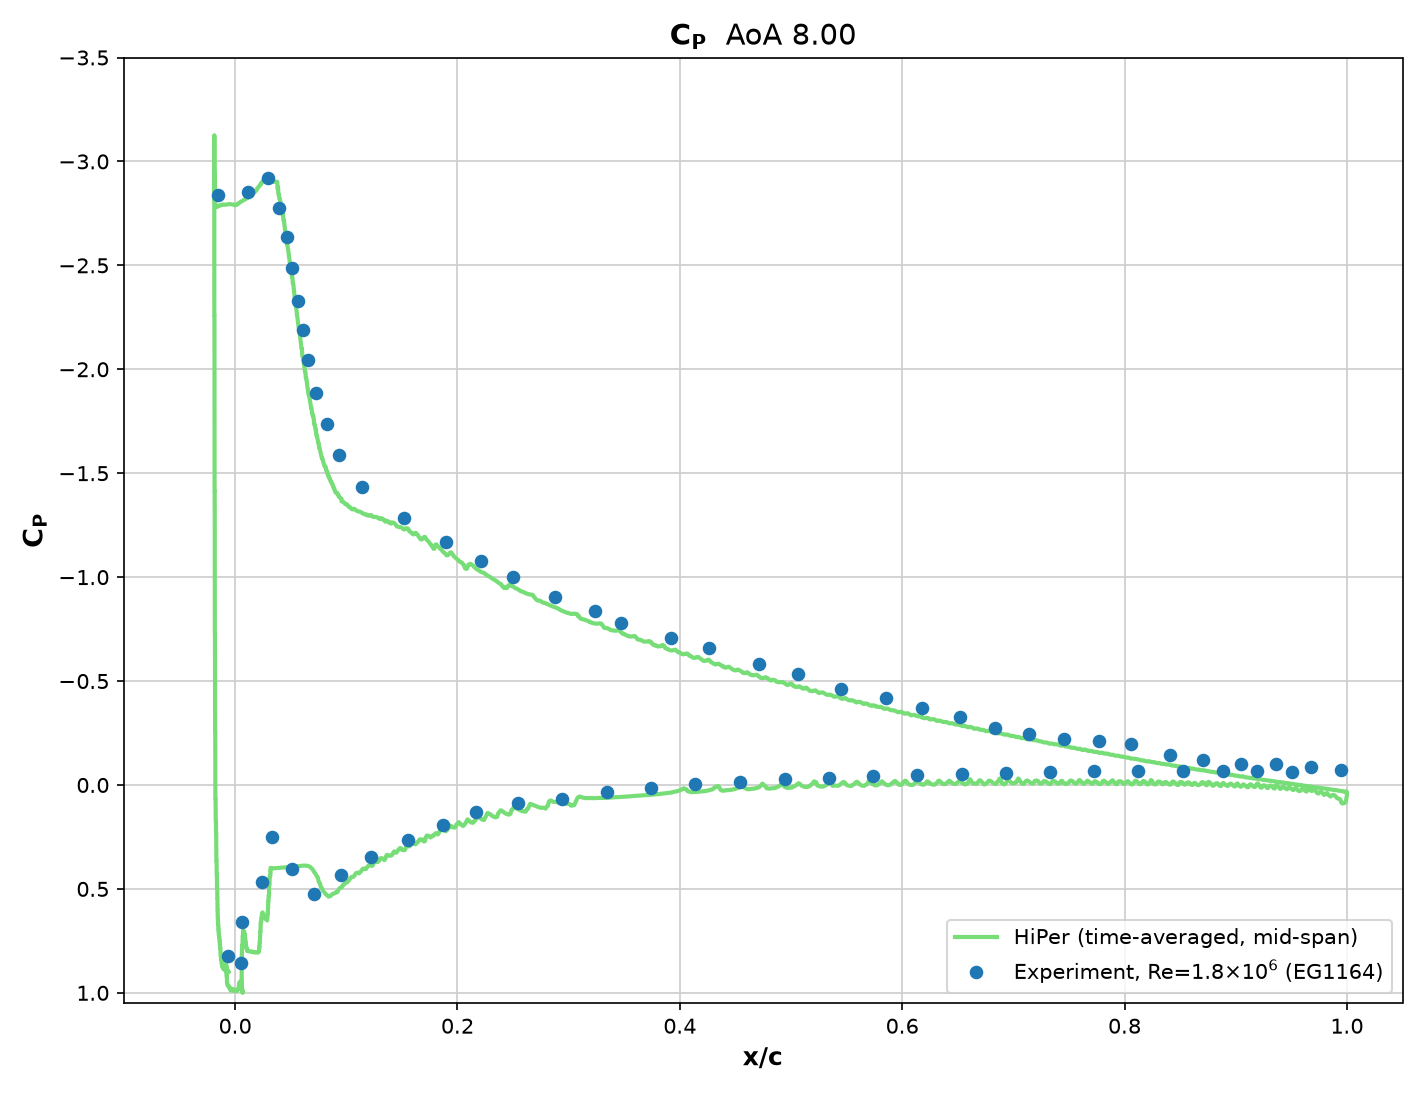
Time-averaged mid-span CP is compared against the pressure taps at 8.0° angle of attack. The suction peak on the horn, the sharp expansion off the horn tip and the pressure plateau over the separated region are all captured, as is the recovery along the rest of the upper surface and the whole of the lower surface.
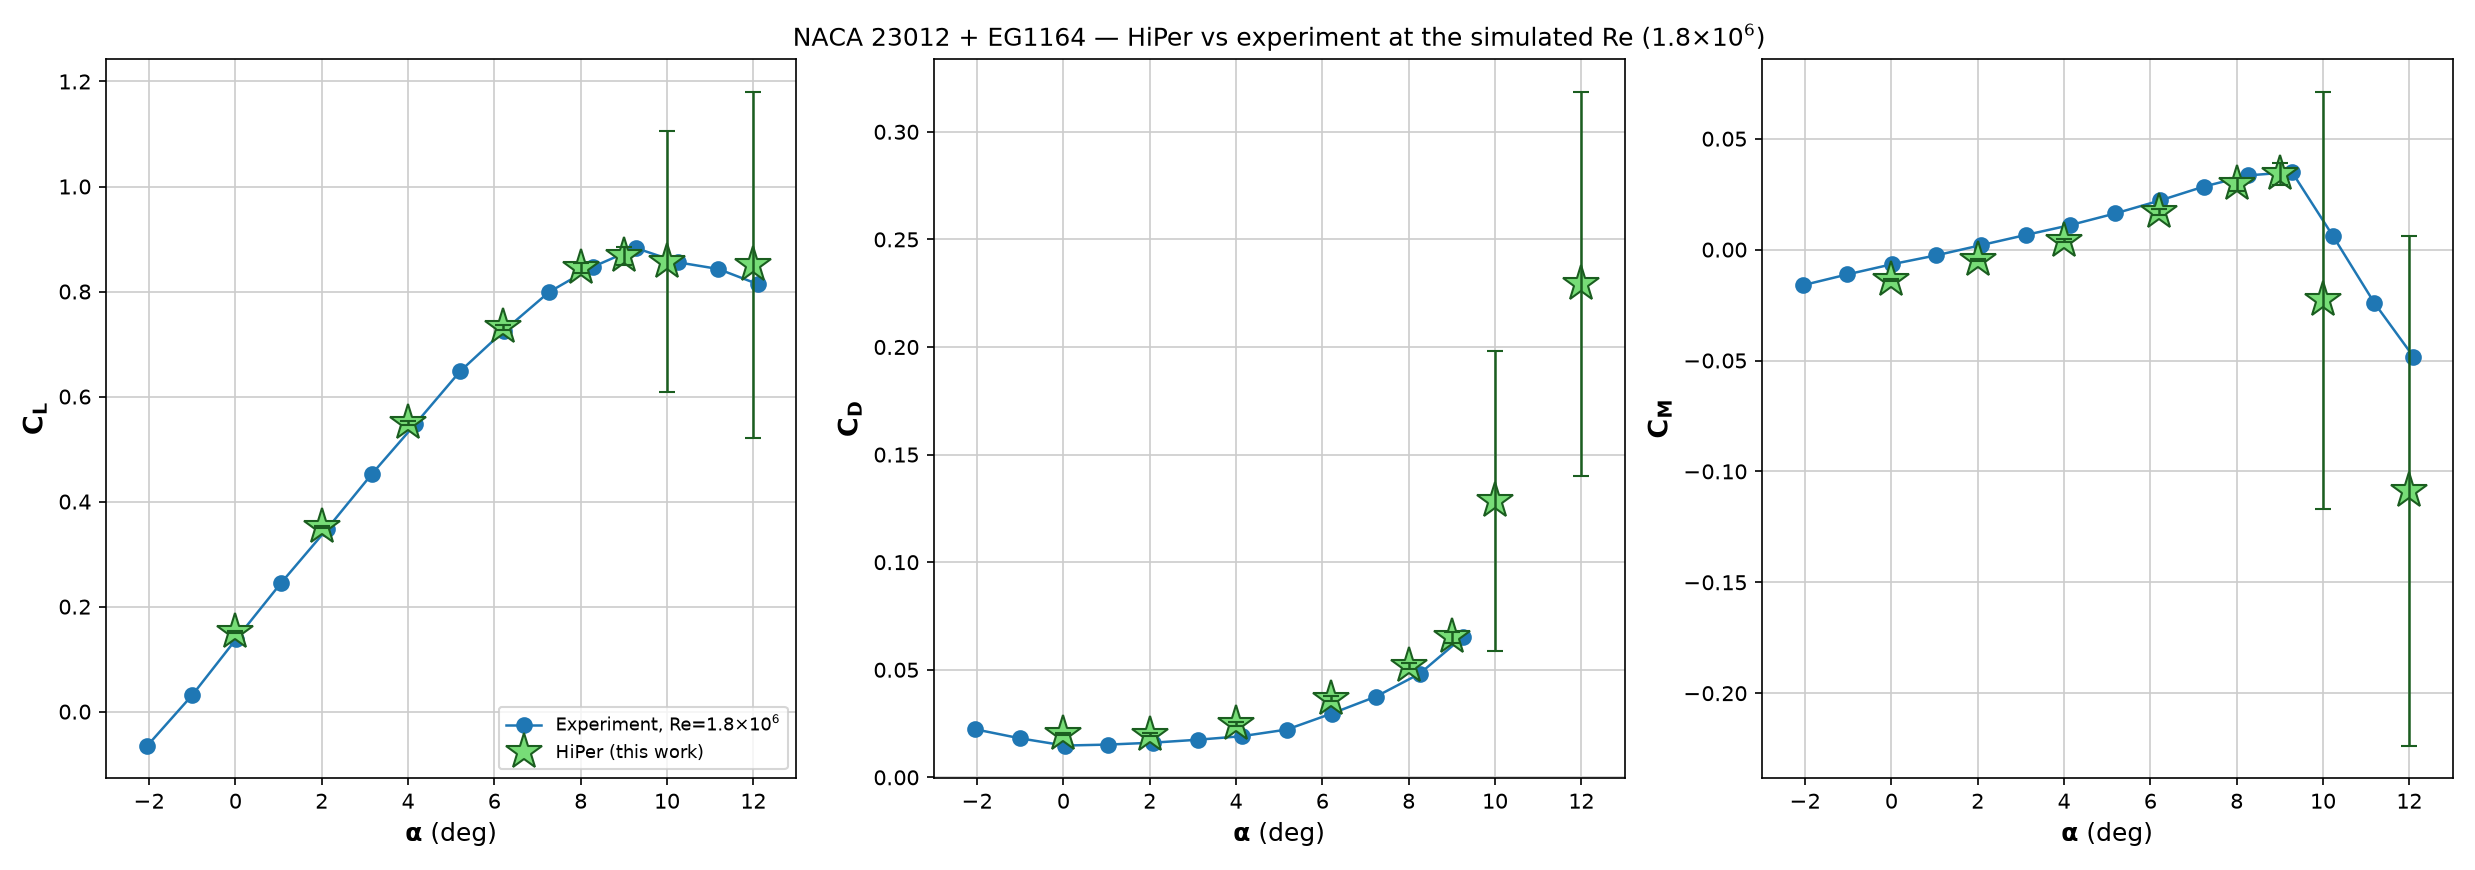
Lift, drag and pitching moment are plotted against angle of attack alongside the wind tunnel measurements at the same Reynolds number. HiPer sits on the measured lift curve across the range, and follows the drag rise and the moment trend. Error bars show the temporal standard deviation (RMS fluctuation) of the coefficient over the averaging window. They are plotted at all angles, but only become visible at 10° and 12°, which lie beyond stall, where the flow is unsteady rather than unconverged.
Flow Visualisation
Computational Performance
53.1M
Mesh Cells
2×
NVIDIA RTX5090 GPU
750 secs
Per Convective Time Unit
Bring HiPer Onboard
Interested in learning what HiPer CFD can do for your organisation. Contact us for more information or to arrange a demo.